
2026 Q2 Multifamily Market Overview
For the past two years, the story in multifamily has been about supply. New units came online faster than renters could absorb them, occupancy dipped, and rent growth stalled across much of the Sun Belt. That narrative is changing.
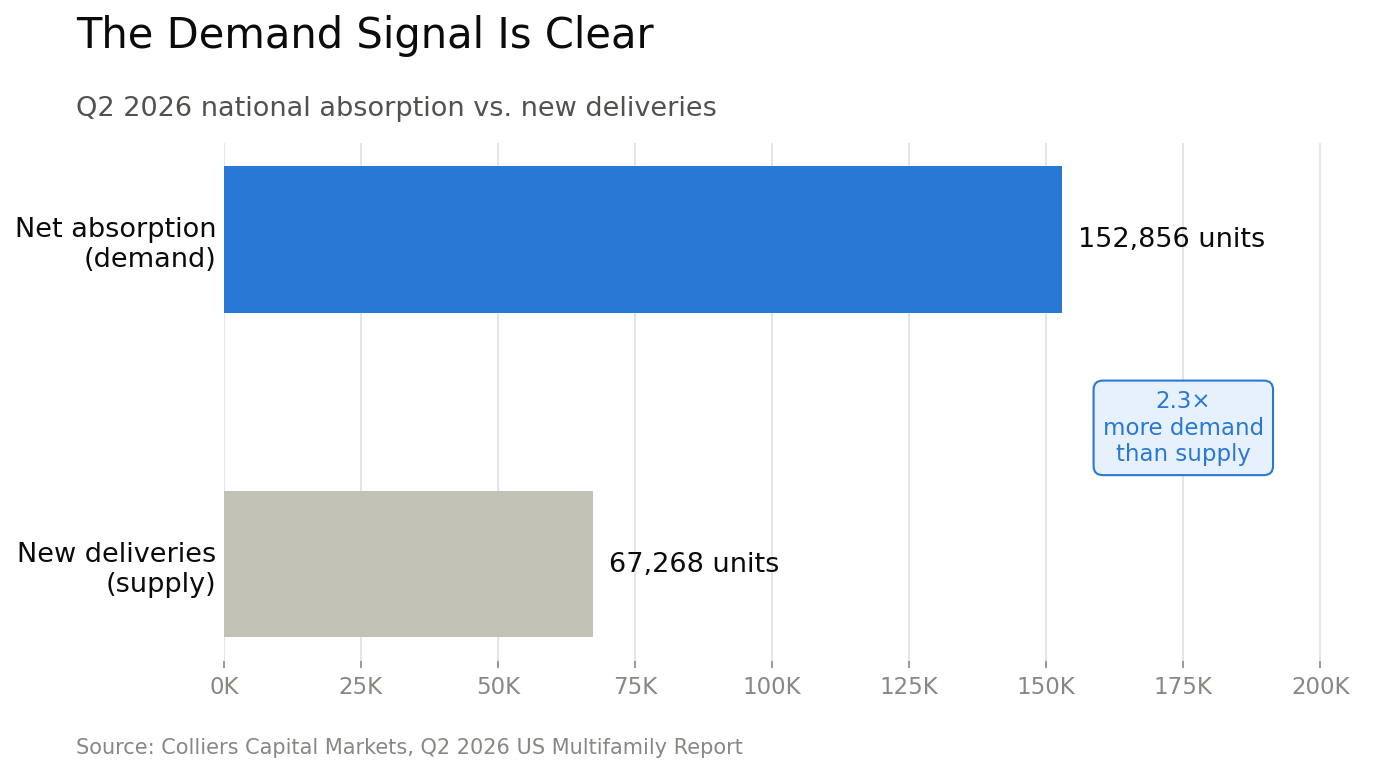
Colliers released its Q2 2026 US Multifamily Report this month, and the headline number is hard to ignore: nationally, renters absorbed 152,856 units in the second quarter while only 67,268 new units were delivered. That is demand outpacing supply by more than two to one.
The National Picture
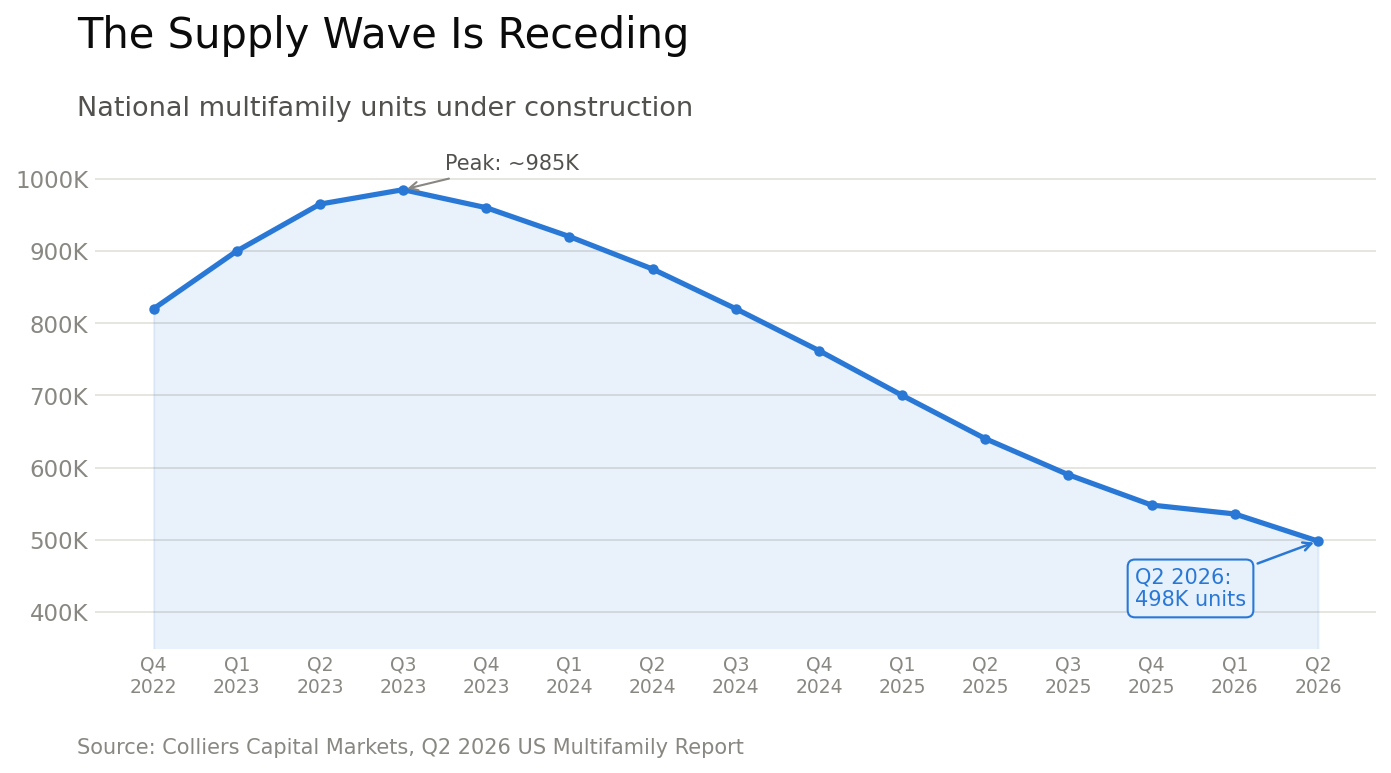
National occupancy climbed to 95.6% in Q2, up from 95.1% the quarter prior. Average effective rents reached $1,970 per month, with trailing rent growth turning slightly positive at 0.4%. The construction pipeline is declining. At 498,090 units currently under construction, it is meaningfully lower than the peak levels of prior years, and fewer starts means fewer deliveries ahead.
The recovery is real, but it is not uniform. Of the 60 markets Colliers tracked, 29 are showing positive rent growth. Coastal and Midwest markets with constrained supply are performing well. Sun Belt markets, which absorbed the bulk of new construction over the past few years, are still working through that inventory. The difference in performance is less about demand and more about how much supply each market had to absorb.
Why the Demand Is Durable
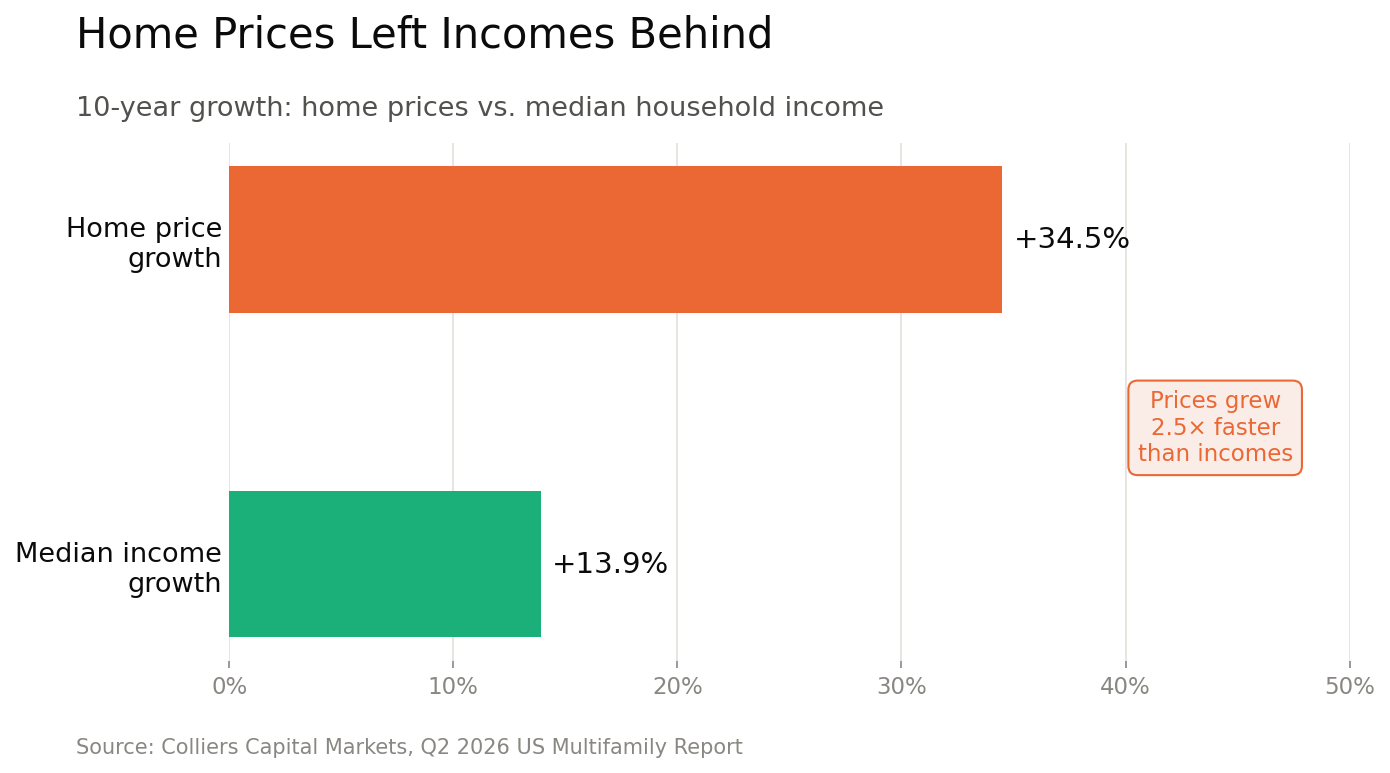
One data point in the report deserves attention. Over the past decade, home prices have risen 34.5% while median household incomes grew just 13.9%. The national median home price is now 4.7 times the median annual income. One in four renters spends more than half their income on housing already. For most Americans, renting is not a lifestyle choice at this point. It is the math.
That dynamic supports multifamily demand regardless of what interest rates do. As long as homeownership remains out of reach for a large portion of the workforce, the rental pool stays deep.
Where Phoenix Stands
Phoenix fits the Sun Belt profile. Rents are still down 4.0% year-over-year, and there are 27,240 units under construction. That is a real number. But the trajectory is shifting in the right direction.
In Q2, Phoenix absorbed 5,541 units while 4,210 were delivered. Demand exceeded supply. Occupancy improved to 94.7%, up 0.3% from a year ago. And that construction pipeline, 27,240 units today, is down from 33,561 units a year ago. Fewer units in the pipeline today means fewer deliveries in 2027 and 2028. The pressure that has held Phoenix rents down is beginning to ease.
The Capital Structure Question
One of the more pointed findings in the Colliers report concerns distress. CMBS delinquency rates hit 7.23% nationally in Q2, up 461 basis points since Q4 2023. Colliers is direct about the cause. The distress is concentrated in assets that were over-leveraged on floating-rate debt. When rates moved, those operators lost margin fast. Occupancy and rents at those properties are often fine. The problem is the capital structure.
That distinction matters. Market-level data can look rough while well-structured assets within that market continue to perform. The investors getting hurt right now are not necessarily in the wrong markets. Many are in the wrong deal structure.
For Our Investors
Through the supply cycle, we maintained high occupancy and held rental rates. We are now seeing Phoenix move past peak supply pressure, with demand absorbing inventory and the pipeline contracting. That is the environment where the discipline of the past two years starts to show up in the results.
For investors watching the broader headlines, Q2 2026 is the first quarter where the data across the board, nationally and in Phoenix, points the same direction. The supply cycle is working through. Demand is durable. And the markets where foundations are sound are beginning to reflect it.
About the author
Neighborhood Ventures